Webhook Troubleshooting and Monitoring
Search delivery logs and review route-level metrics to diagnose and monitor webhook performance
Searching deliveries sent to a webhook route
If you need to track down and analyze specific webhook event deliveries, our system has a search tool that helps with this task.
This becomes especially useful when troubleshooting a delivery error, verifying the status of a recent event, or conducting a routine audit of webhook traffic. The tool offers a wide range of filters to narrow down results and make the search process easier.
To search for deliveries on a given webhook route, follow these steps:
- Log in to Ordergroove.
- Go to Developers > Webhooks.
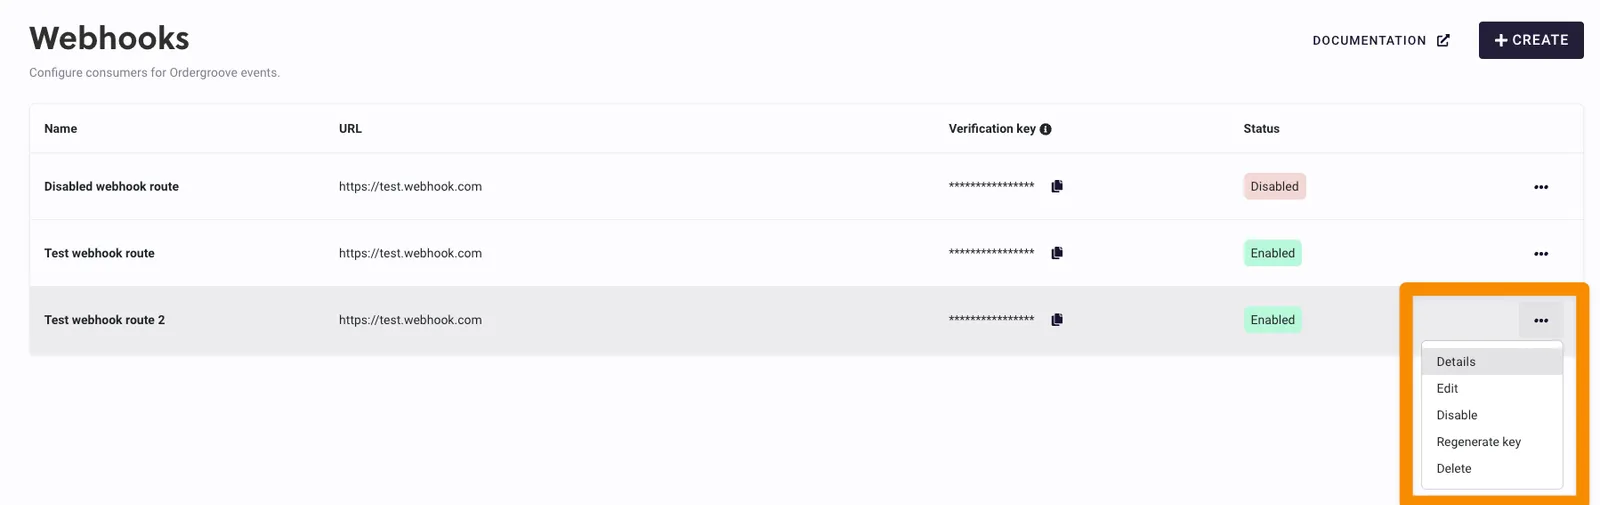
- Locate the webhook you want to inspect, click the 3 dots, and select Details.
-
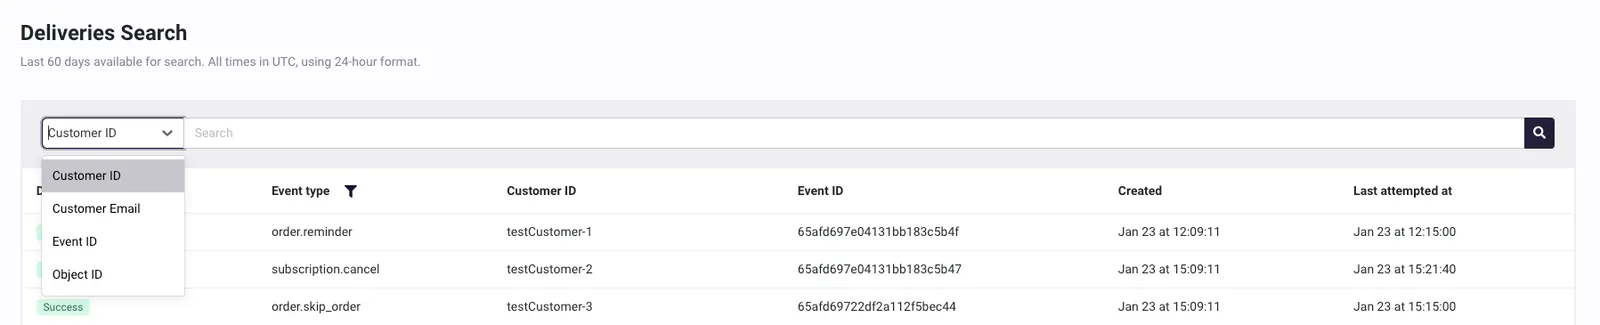
Under the Deliveries Search section, use the search bar to track down webhook deliveries by filtering on different fields:
- Customer ID: Customer identifier in the client’s system involved in the event being searched for.
- Customer Email: Customer email involved in the event being searched for.
- Event ID: Internal Ordergroove identifier of an event. Useful when you have an ID from a previous search and need to jump directly to a specific event.
- Object ID: Subscription public ID, order public ID, item public ID, or customer ID involved in the event. The first three refer to Ordergroove public IDs for the different entities (widely used in our REST APIs), while the last is the customer identifier in the client’s system. For example, if searching for events tied to subscription ID X, results may include a
subscription.cancelevent for that subscription that was successfully delivered 5 minutes ago.
-
Select the desired filter, enter the value to search by, and click the magnifying glass button at the right of the search bar to see the results.
-
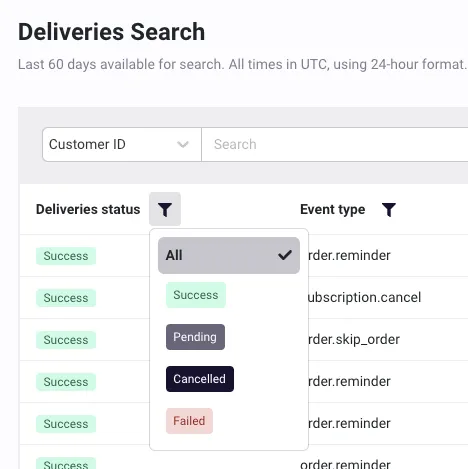
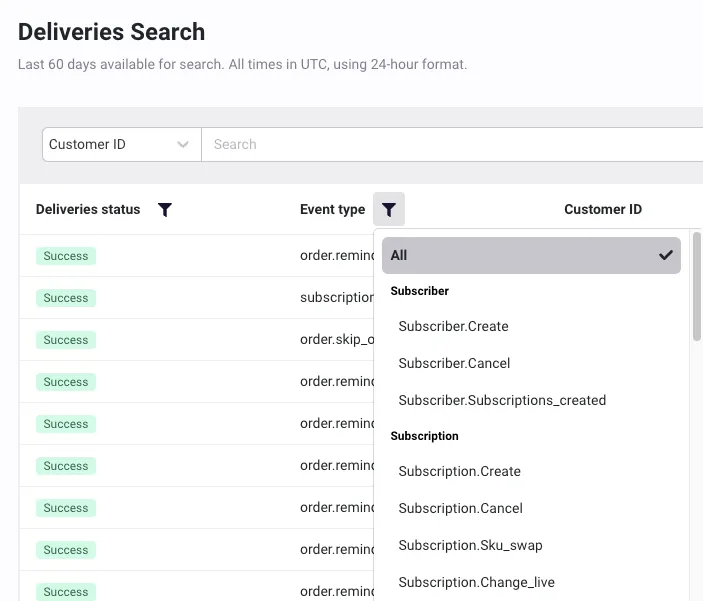
Two additional filters can be applied by selecting the icons in the first two columns of the results table:
- Delivery status: Possible options are:
- Pending: Deliveries currently in transit — includes both first-time deliveries and those being retried.
- Success: Deliveries successfully transmitted to the target.
- Canceled: Deliveries that were in transit when the webhook route was disabled or deleted and had to be canceled.
- Failed: Deliveries that failed to be transmitted to the target.
- Event type: Filter will display the currently existing event types available to filter by.
- Delivery status: Possible options are:
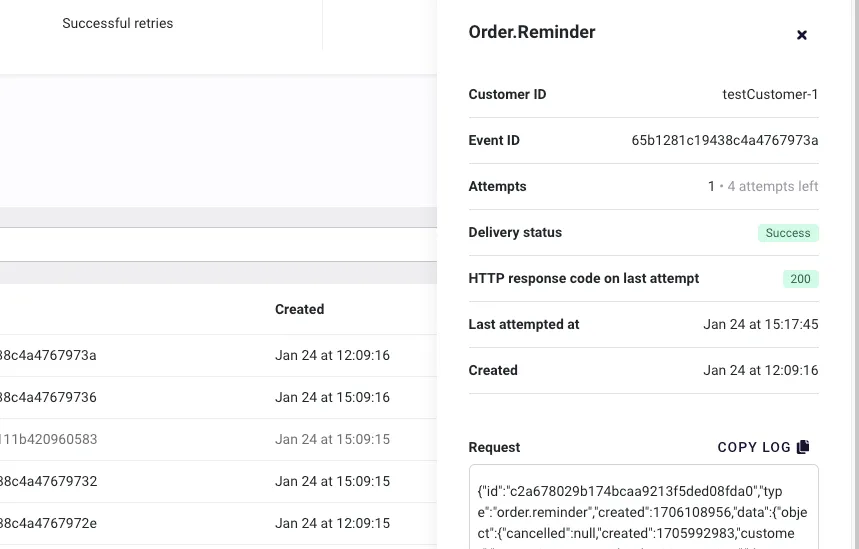
- Click on a row in the results to view the details of the selected delivery. This includes useful information such as the request sent to the target, the response received, the number of delivery attempts made, and more.
Watching webhook route metrics
Ordergroove makes high-level metrics available for each webhook route so you can get a quick summary of how webhooks are performing.
To view metrics for a given route:
- Log in to Ordergroove.
- Go to Developers > Webhooks.
- Locate the webhook you want to inspect, click the 3 dots, and select Details.
-
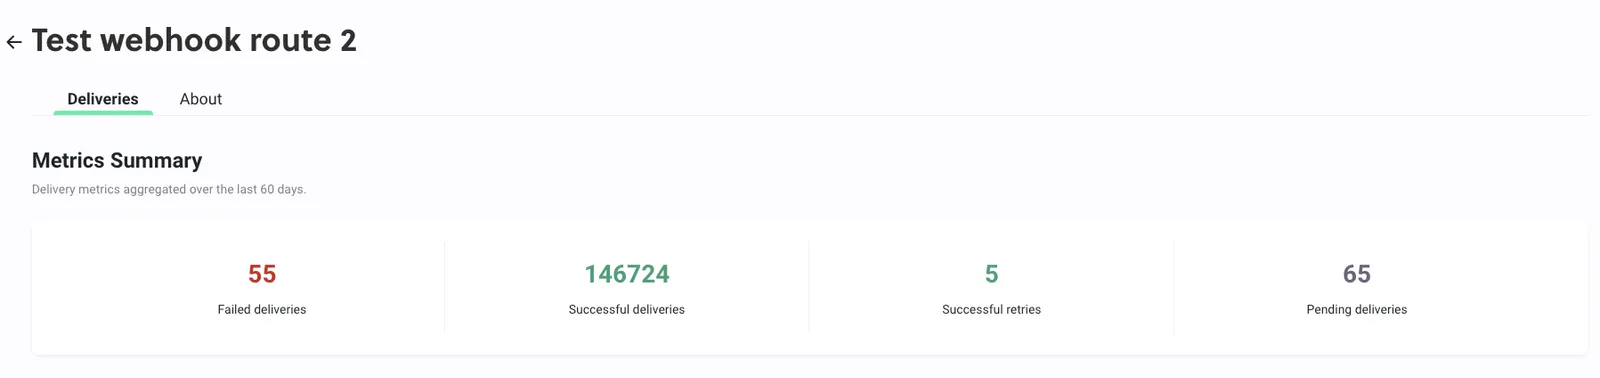
In the Metrics Summary section, you can access various key metrics related to webhook deliveries:
- Failed Deliveries: The number of webhook events that failed to reach the target, either due to initial sending failures or successive error responses from the target. This includes events that were retried but ultimately failed in line with our retry policy. A high count may indicate network problems or misconfigurations at the target endpoint — reviewing the target’s error logs and configuration is recommended.
- Successful Deliveries: The total number of webhook events successfully delivered to the target and acknowledged without issues.
- Successful Retries: A subset of Successful Deliveries — counts deliveries that were initially unsuccessful but eventually succeeded upon retrying. Useful for identifying transient issues that may affect delivery success.
- Pending Deliveries: Deliveries currently in transit, including both first-time deliveries and those being retried. Pending status indicates these deliveries are either awaiting a response from the target or scheduled for retry according to the retry policy.